Reading Flame Graphs
Flame graphs are a visualization tool for profiling software. They provide a graphical representation of your program’s execution, making it easier to understand the runtime complexities involved. Let’s start with an example: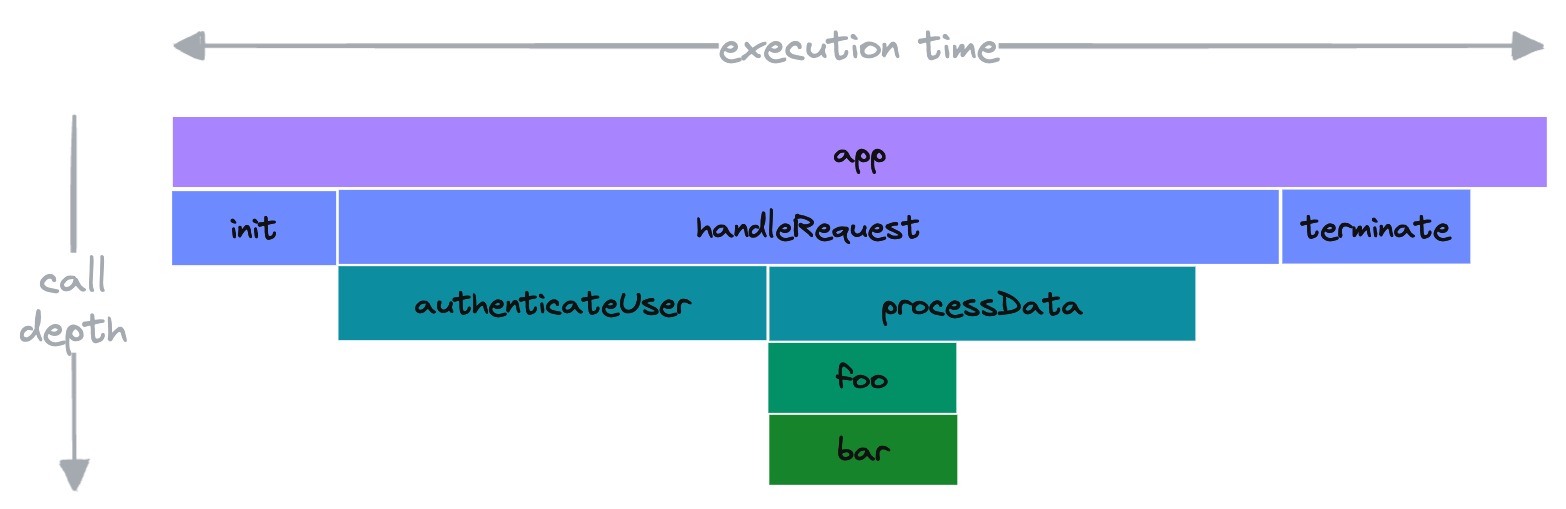
- The root caller is the
appfunction. appcalls theinit,handleRequestandterminatefunctions.handleRequestcalls bothauthenticateUserandprocessData.processDatacallsfoowhich in turn callsbar.
Aggregated function calls
Functions calls are aggregated, so if a function is called multiple times, the time spent in all calls is aggregated into a single block. Thus, the following code: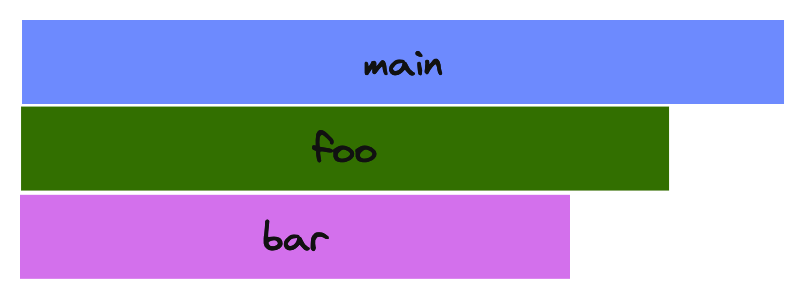
foo function is called twice and the bar function is called 4
times, but the time spent is aggregated into a single block for each function.
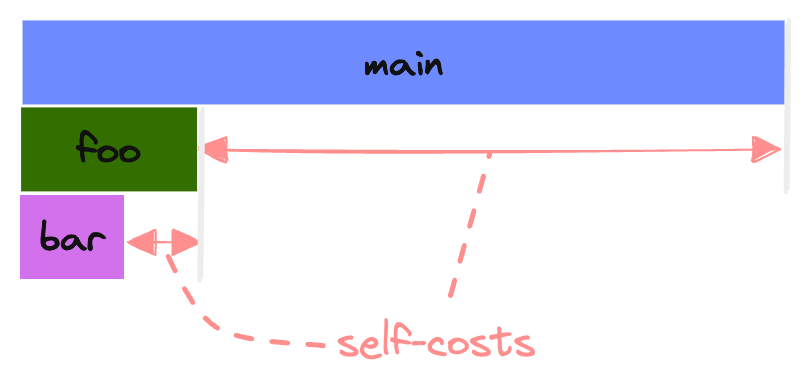
Self-costs
In the previous example, we could see the global cost of each function call quite clearly. However, it can be tricky to find out how much time was spent within the function itself.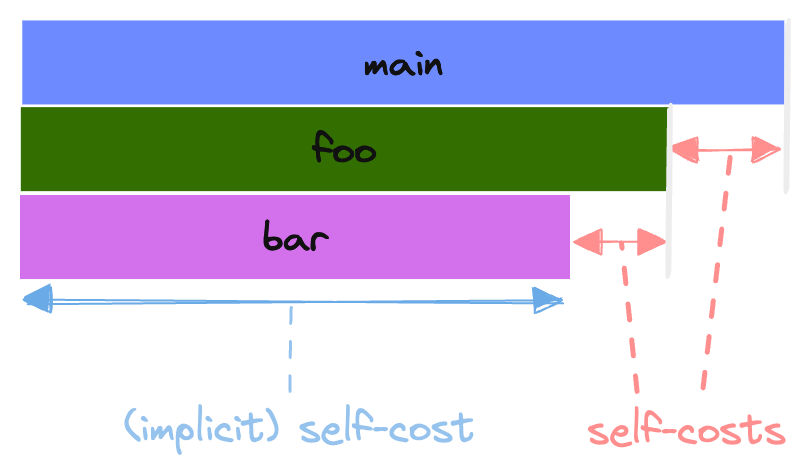
- (implicit) self-costs: the time spent in the function itself is the whole width of the rectangle since it doesn’t call any other functions.
- self-costs: the self-cost here is visible as the space not occupied by the children of the block.
Self-costs in interpreted languagesIn Python or Node.js, the self-cost is the time spent in the function itself,
but also the time spent by the interpreter. This means that a function will
always have a self-cost, even if the function does nothing.
main being
much bigger than before:
Viewing Flame Graphs
On the pull request page, you can access the flame graphs of a benchmark by expanding it.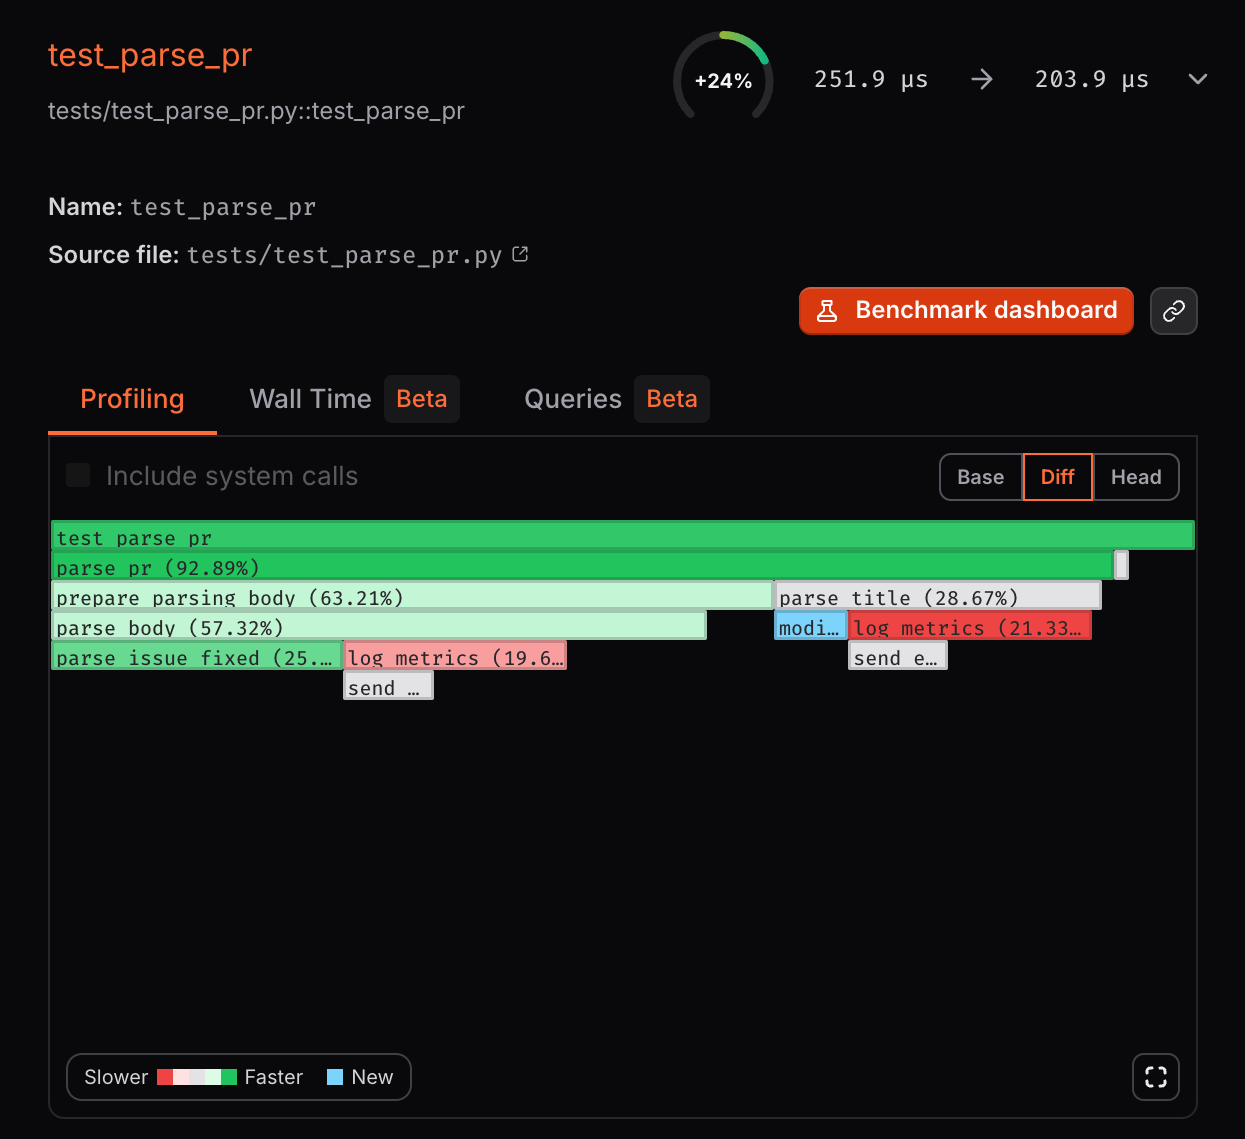
- Base: flame graph of the benchmark base run
- Head: flame graph of the benchmark run from the latest commit of the pull request
- Diff: difference between the head and the base flame graphs
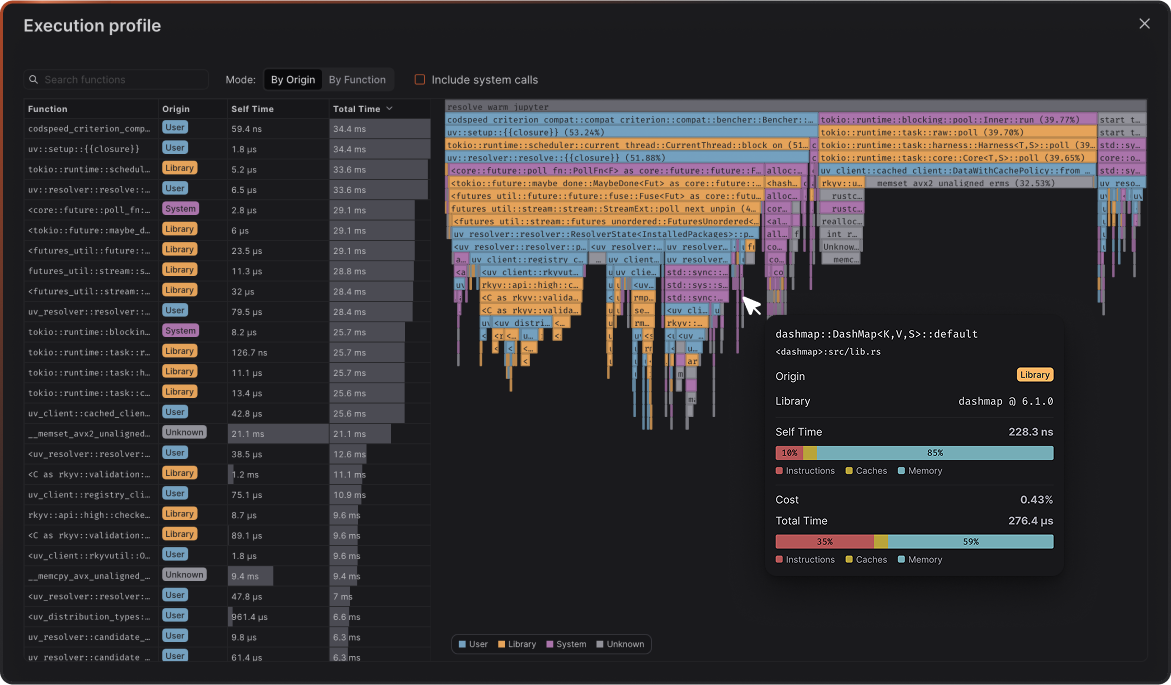
Inspector
Hover any bar to open the span details. This panel shows you what the function is, where it comes from, and how its time is spent.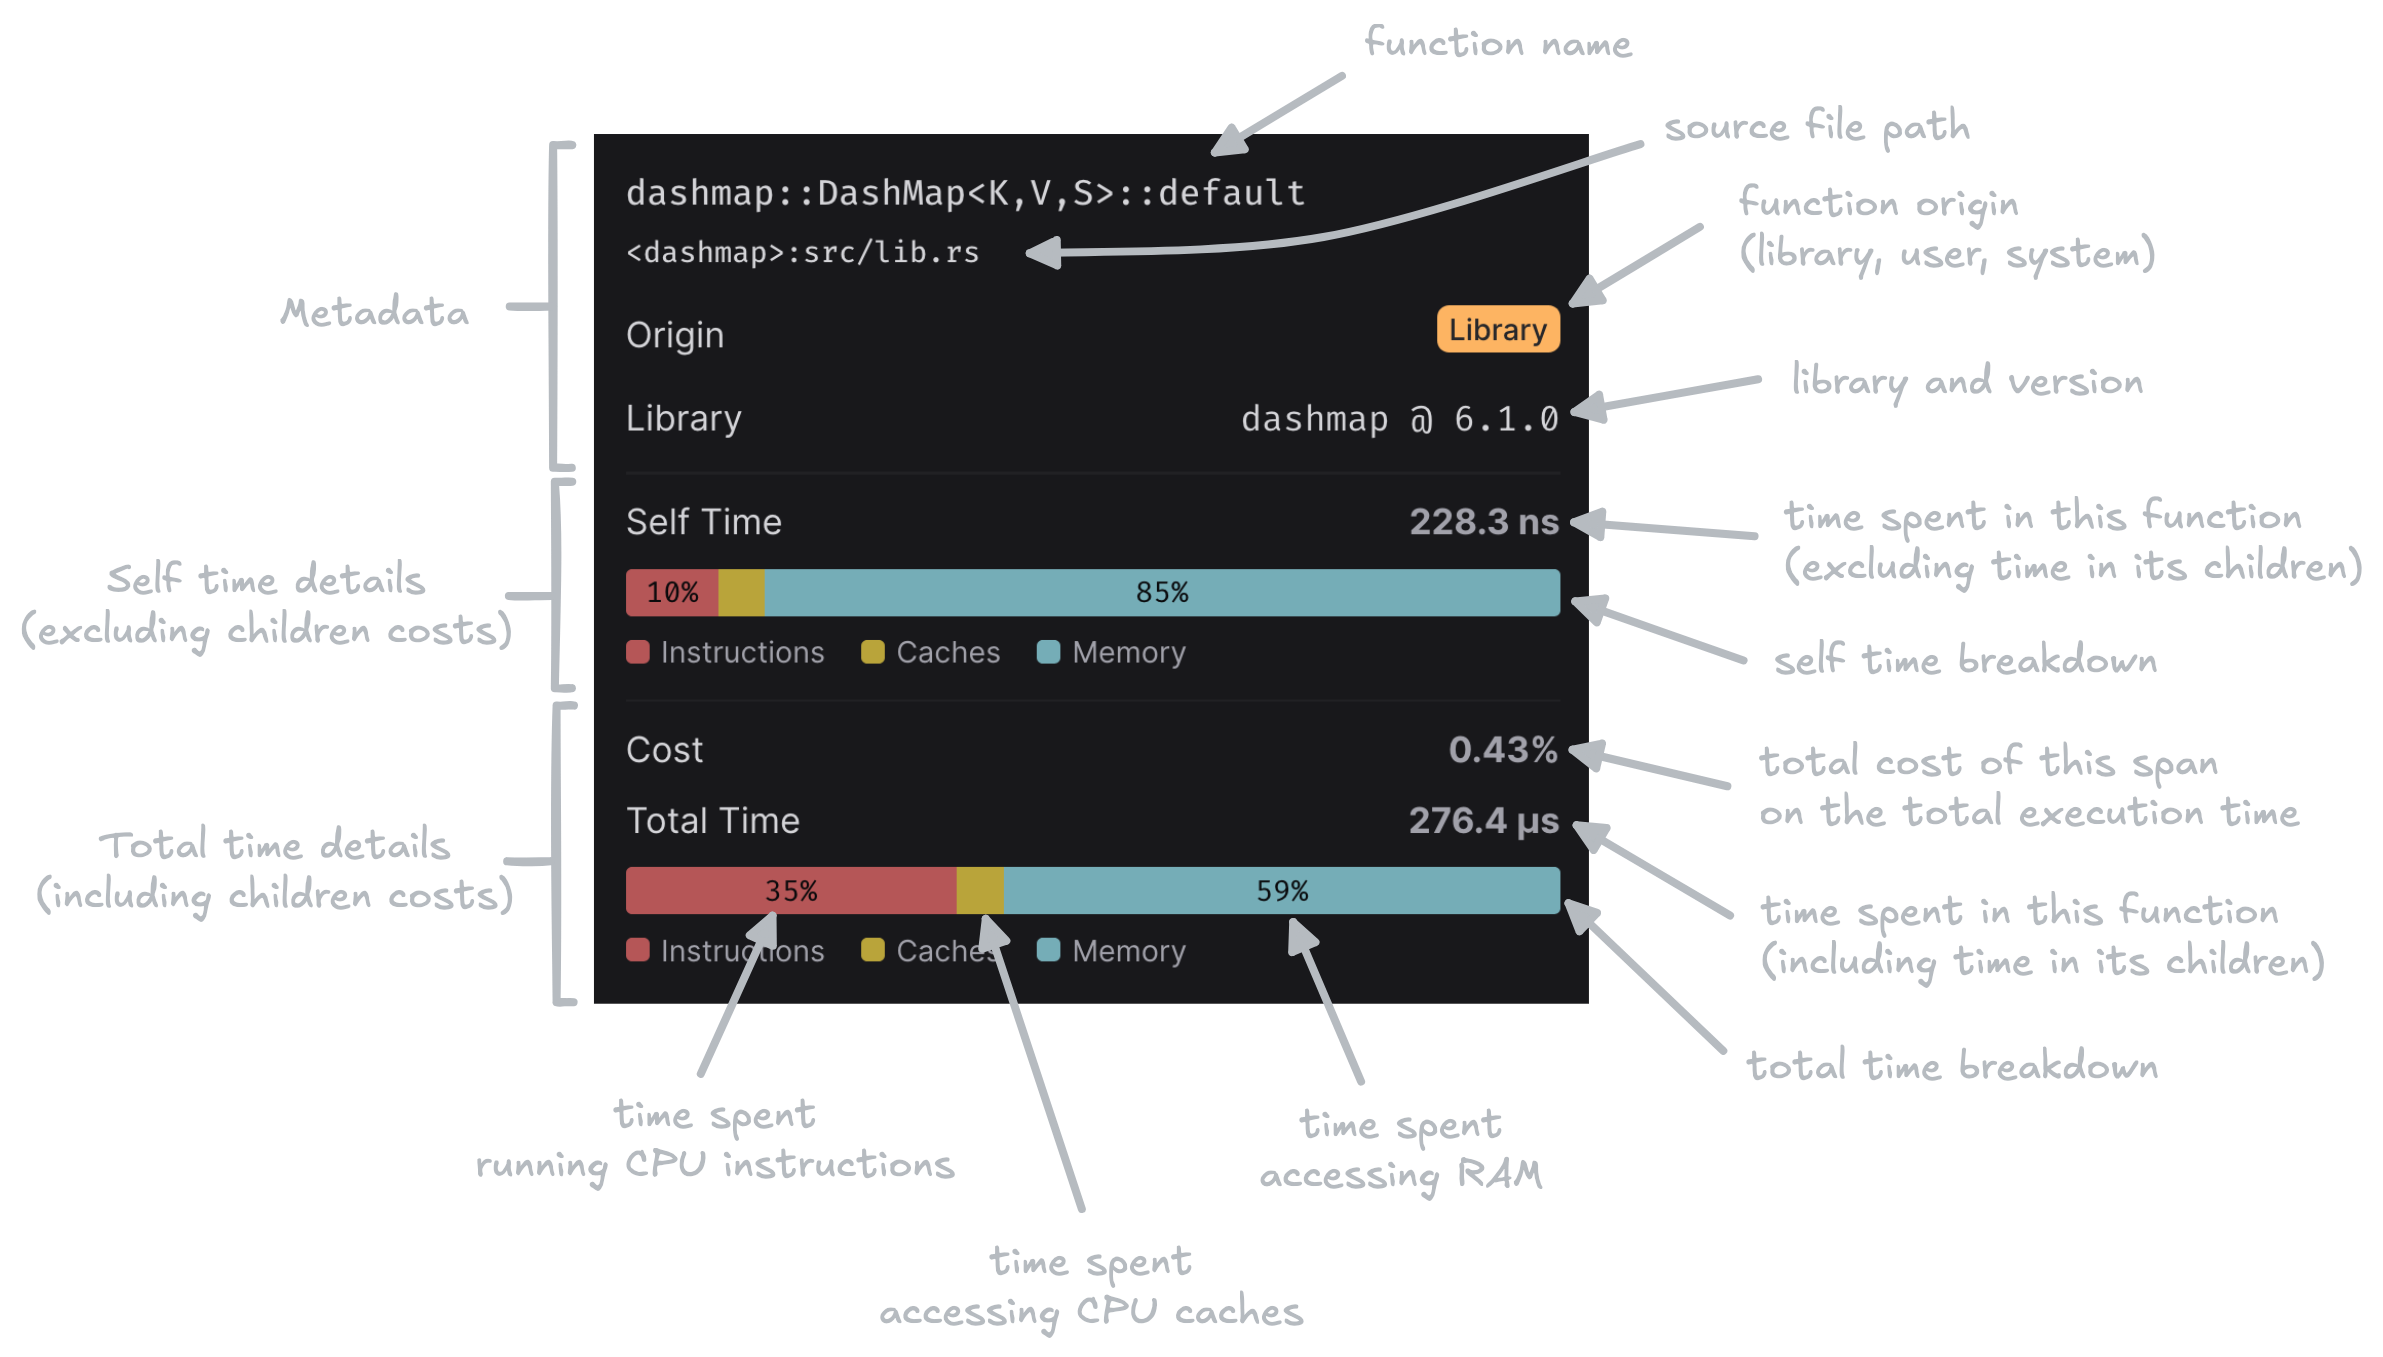
- Metadata: Function name, source file, code origin
- Self time: Time spent in the function body only, excluding child calls.
- Total time: Time spent in the function including all its children.
Color modes
By Origin
Colors by code origin: User, Library, System, or Unknown. Useful to separate your code from dependencies and the kernel.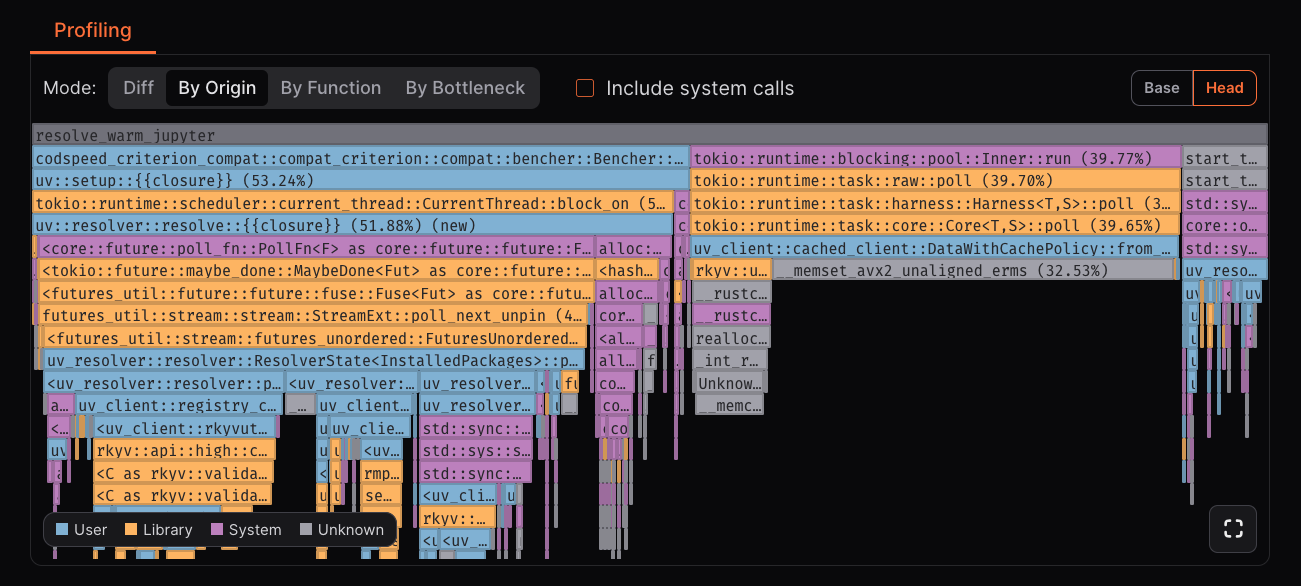
Differential
Compares Base vs Head and colors spans by change: slower, faster, added, or removed. Ideal for scanning regressions and wins after a commit.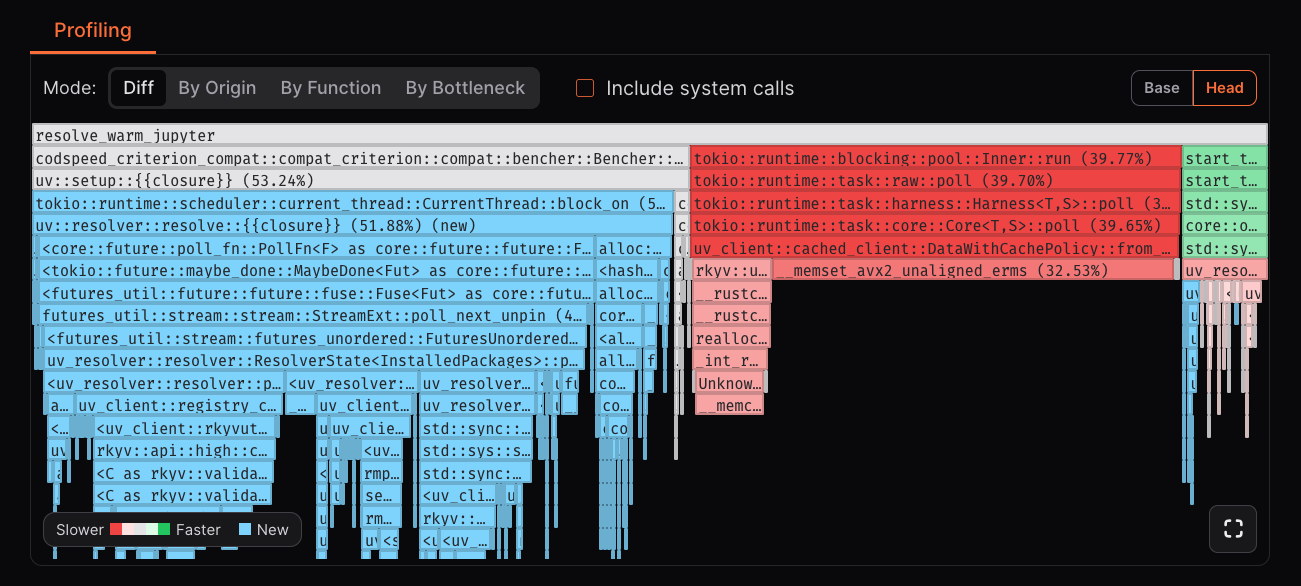
- Slower: The span is slower than in the base run.
- Faster: The span is faster than in the base run.
- Added: The span has been added in the head run.
- Removed: The span is removed in the head run.
By Bottleneck
Colors each span by the dominant bound on its self time: instruction-bound, cache-bound, memory-bound, or system-bound. Fast way to see what is blocking work.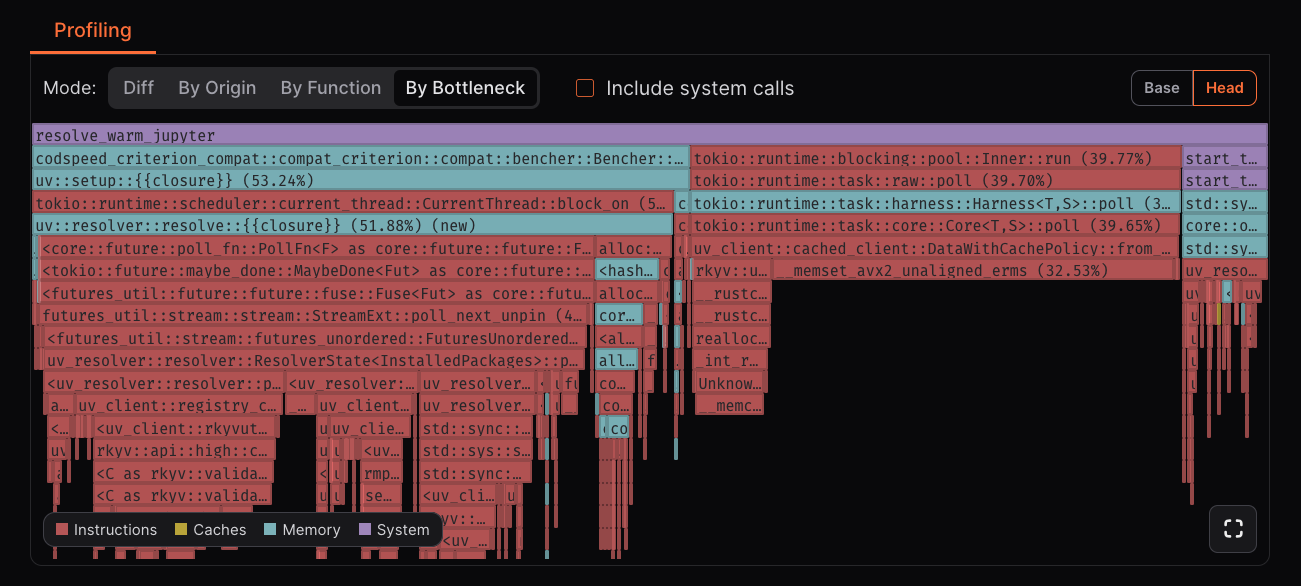
By Function
Colors spans by function symbol so identical functions share a color, no matter where they are called. Helps spot hot functions across call sites.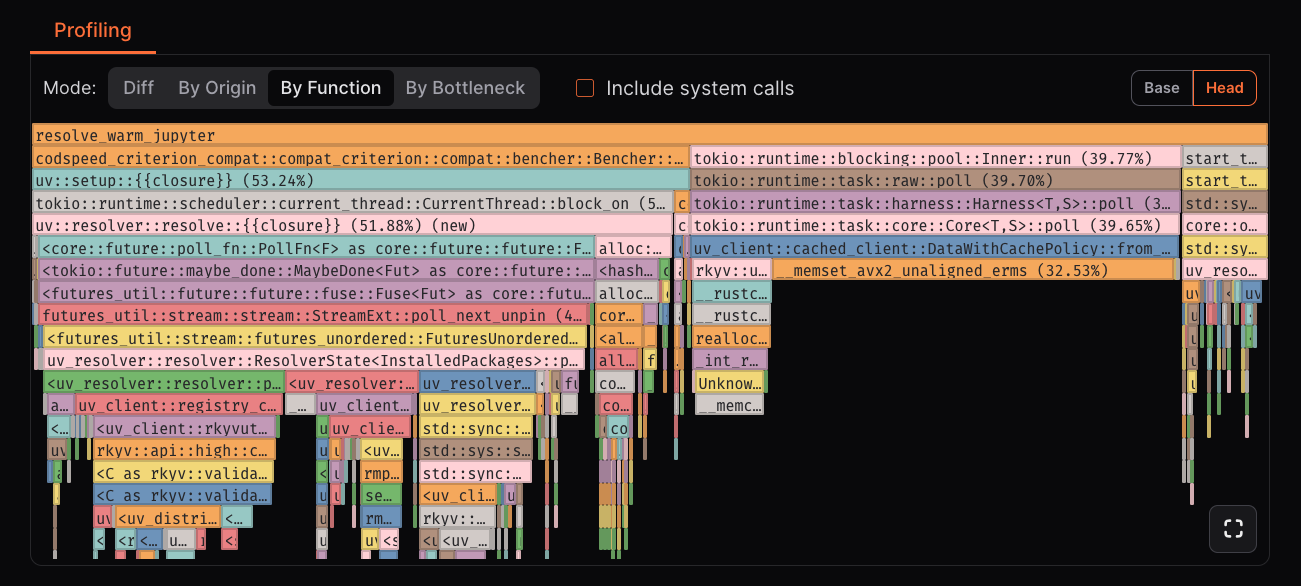
System Calls toggle
Include kernel and low-level runtime contributions. Off keeps focus on application and library code.Function list
Upon expanding a flamegraph, you can access the function list. And dive in the details of each span.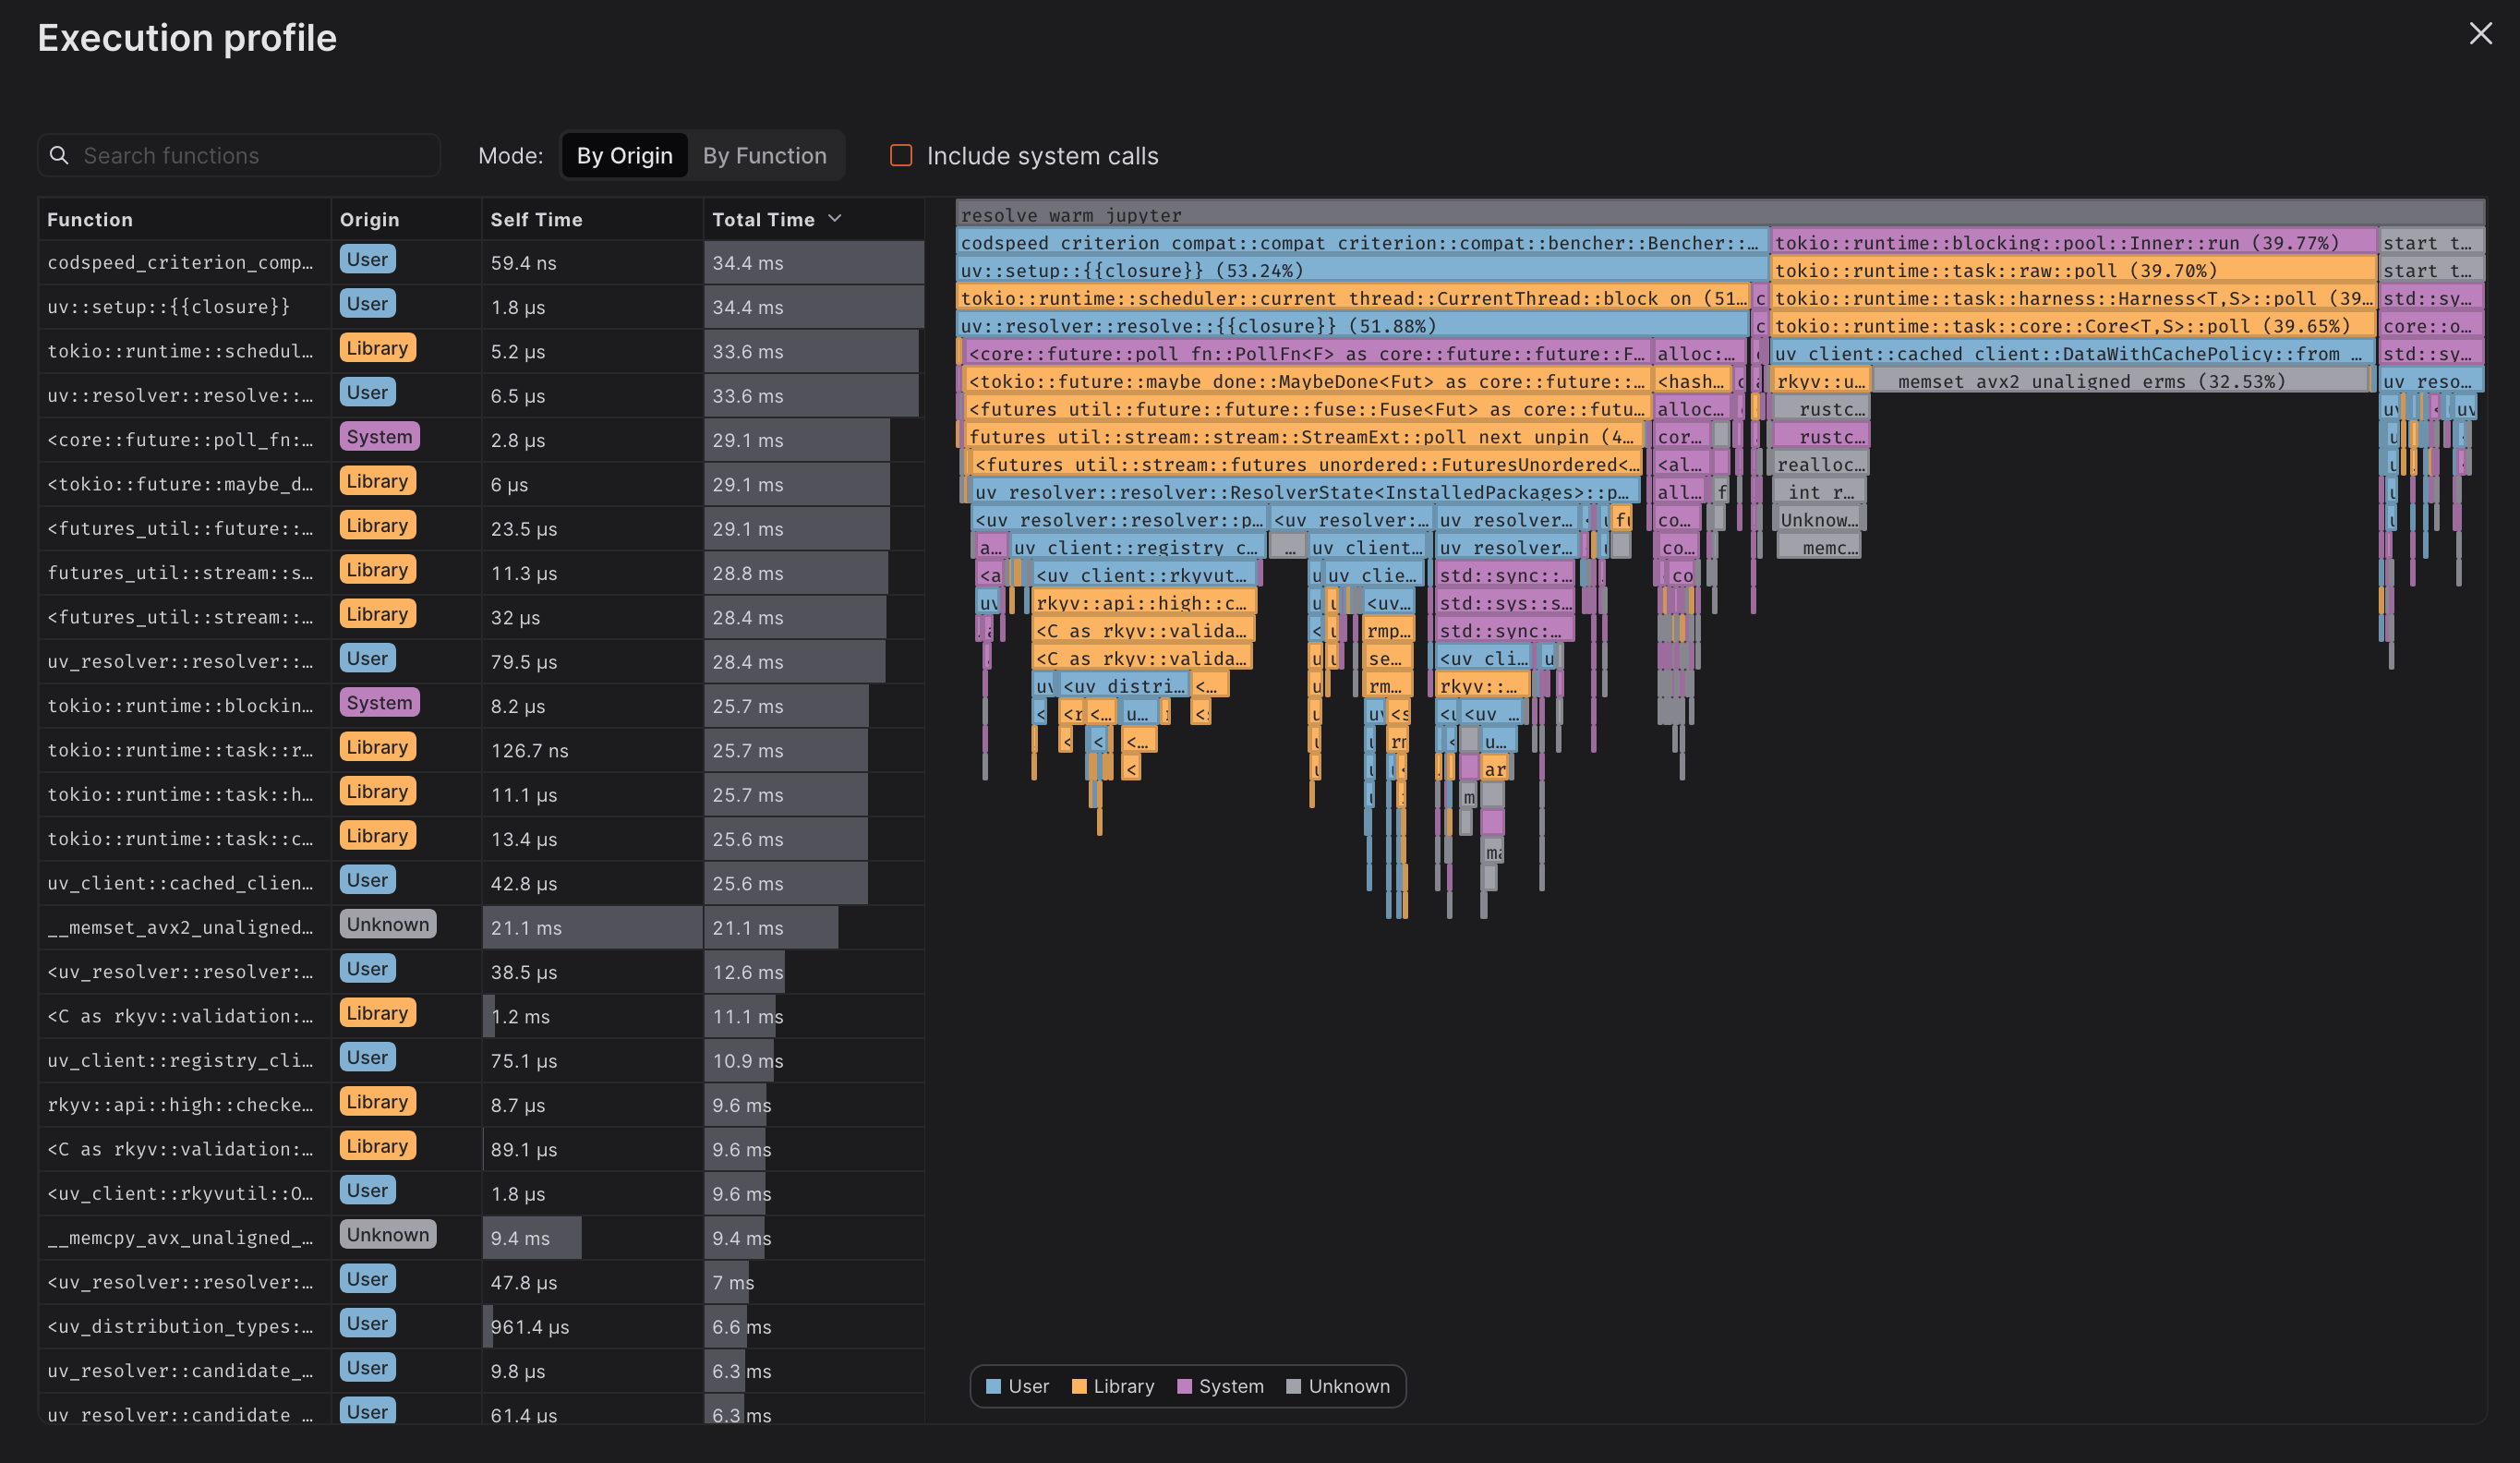
Next Steps
Setup Benchmarks with CPU Simulation
Learn how to enable CPU Simulation to generate flame graphs
Setup Benchmarks with the Walltime instrument
Learn how to enable Walltime instrumentation to generate flame graphs
Performance Regression Detection
Set up automated checks to catch performance issues early
Benchmark Creation Guides
Create comprehensive benchmarks for your codebase